Heatmap in Python
What is heatmap?
- Continuous colormap where each color represents a specific set of values
- Great way to visualize and identify statistically significant gene expression changes among hundreds to thousands of genes from different treatment conditions
How to create a heatmap using Python?
- We will use
bioinfokit v0.6or later - Check bioinfokit documentation for installation and documentation
- For generating a heatmap plot, I have used gene expression data published in Bedre et al. 2015 to identify gene expression changes (induced or downregulated) in response to fungal stress in cotton. (Read paper). Here’s you can download gene expression dataset used for plotting heatmap: dataset
Now plot heatmap with hierarchical clustering using bioinfokit,
# you can use interactive python interpreter, jupyter notebook, google colab, spyder or python code
# I am using interactive python interpreter (Python 3.7)
>>> from bioinfokit import analys, visuz
# load dataset as pandas dataframe
>>> df = analys.get_data('hmap').data
>>> df.head()
Gene A B C D E F
0 B-CHI 4.505700 3.260360 -1.249400 8.89807 8.05955 -0.842803
1 CTL2 3.508560 1.660790 -1.856680 -2.57336 -1.37370 1.196000
2 B-CHI 2.160030 3.146520 0.982809 9.02430 6.05832 -2.967420
3 CTL2 1.884750 2.295690 0.408891 -3.91404 -2.28049 1.628820
4 CHIV 0.255193 -0.761204 -1.022350 3.65059 2.46525 -1.188140
# set gene names as index
>>> df = df.set_index(df.columns[0])
>>> df.head()
A B C D E F
Gene
B-CHI 4.505700 3.260360 -1.249400 8.89807 8.05955 -0.842803
CTL2 3.508560 1.660790 -1.856680 -2.57336 -1.37370 1.196000
B-CHI 2.160030 3.146520 0.982809 9.02430 6.05832 -2.967420
CTL2 1.884750 2.295690 0.408891 -3.91404 -2.28049 1.628820
CHIV 0.255193 -0.761204 -1.022350 3.65059 2.46525 -1.188140
# heatmap with hierarchical clustering
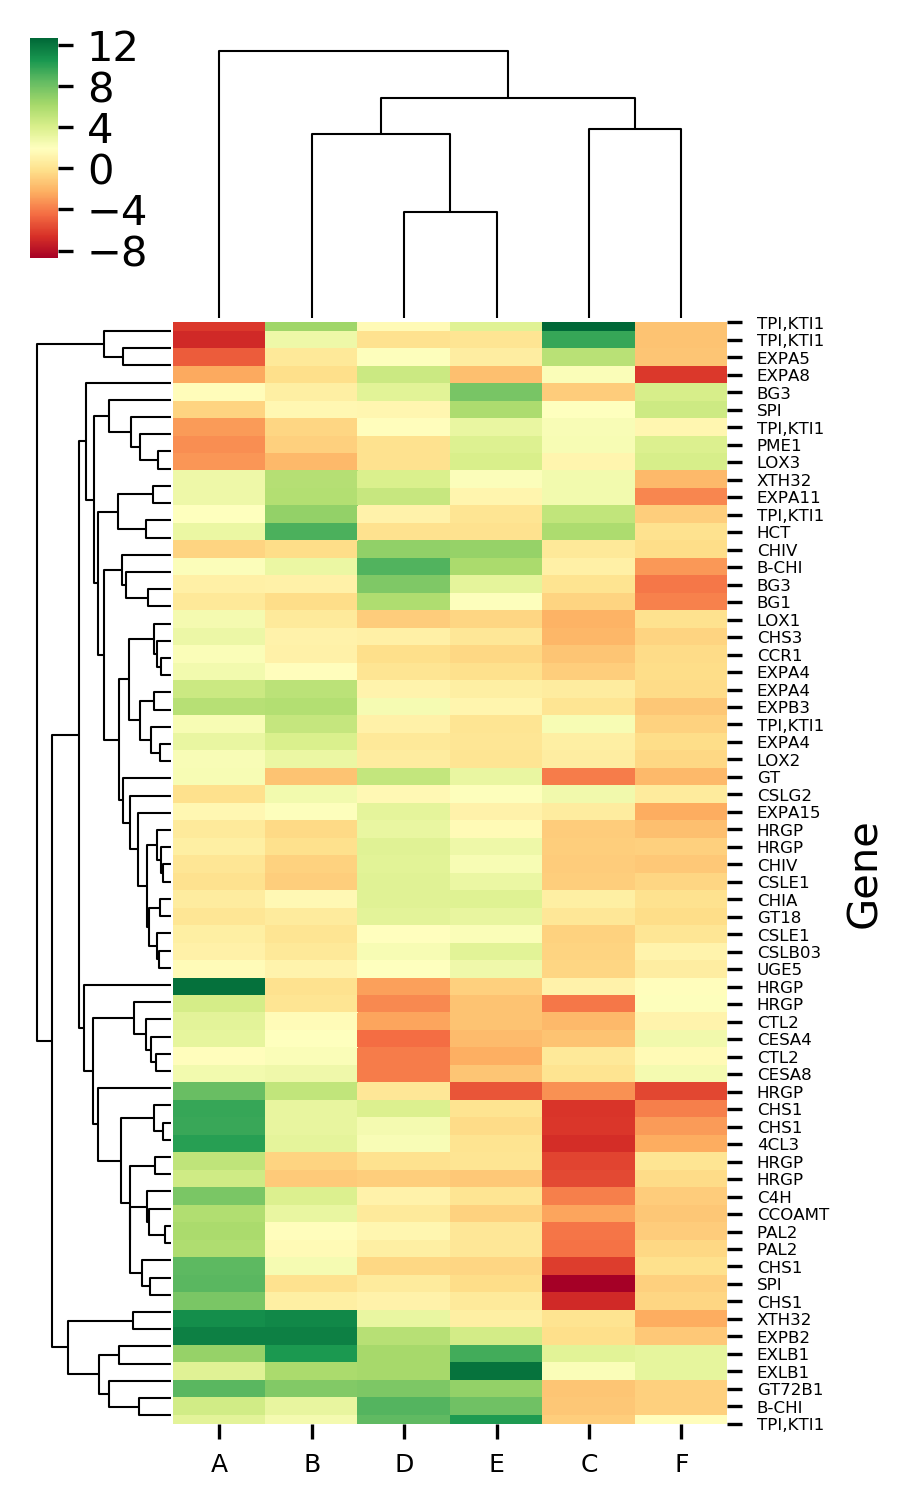
>>> visuz.gene_exp.hmap(df=df, dim=(3, 6), tickfont=(6, 4))
# heatmap without hierarchical clustering
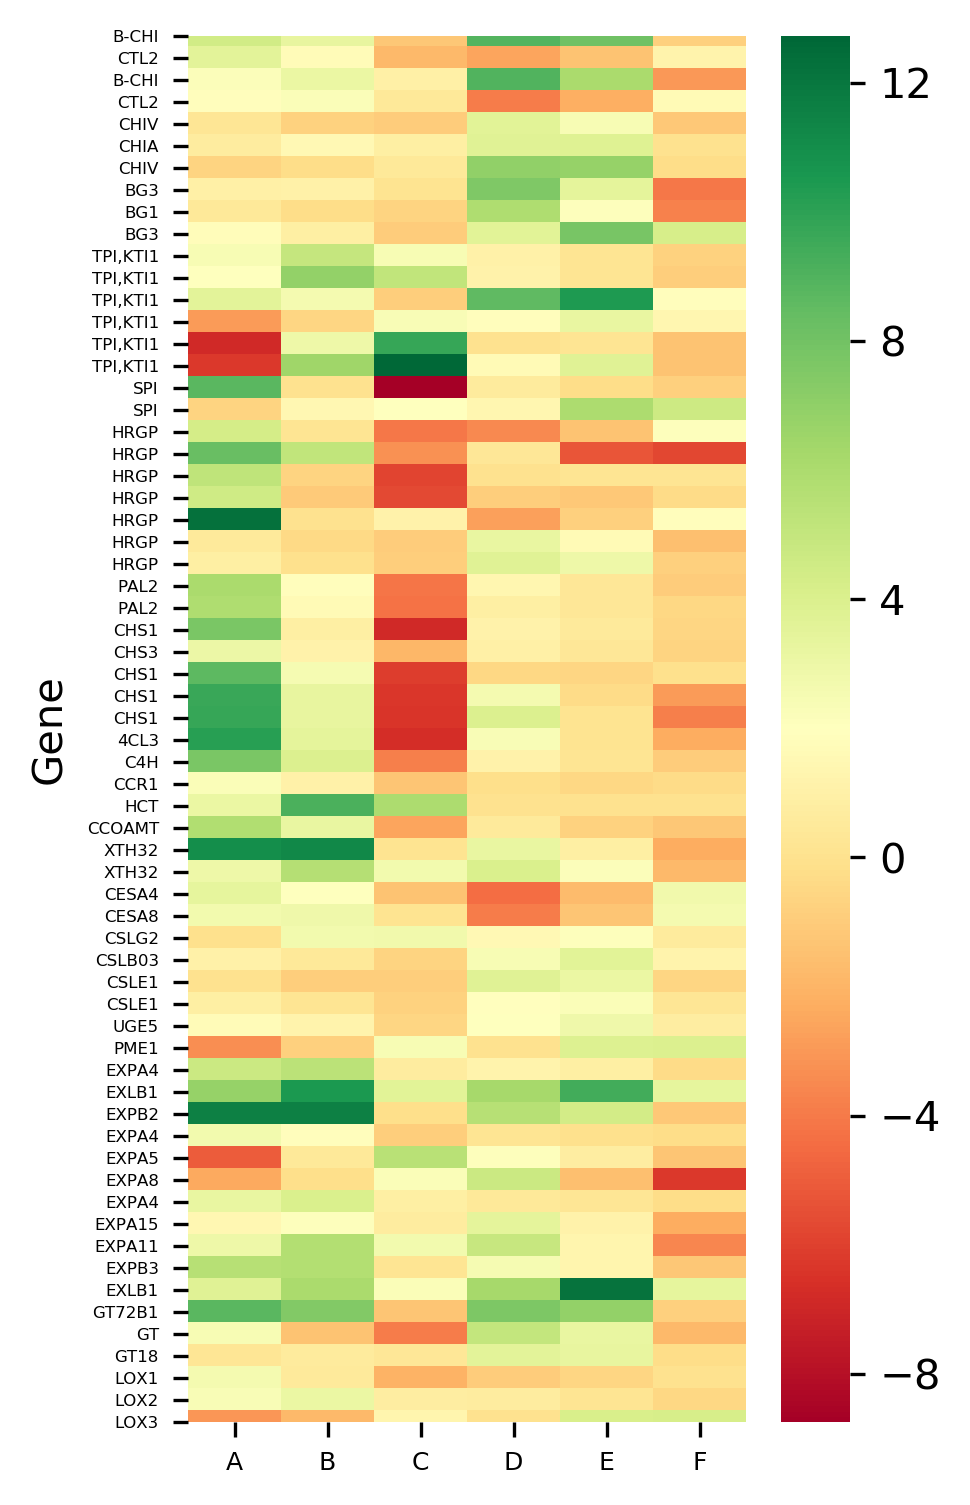
>>> visuz.gene_exp.hmap(df=df, clus=False, dim=(3, 6), tickfont=(6, 4))
# heatmaps will be saved in same directory
# set parameter show=True, if you want view the image instead of saving
Generated heatmaps with and without hierarchical clustering by above code,
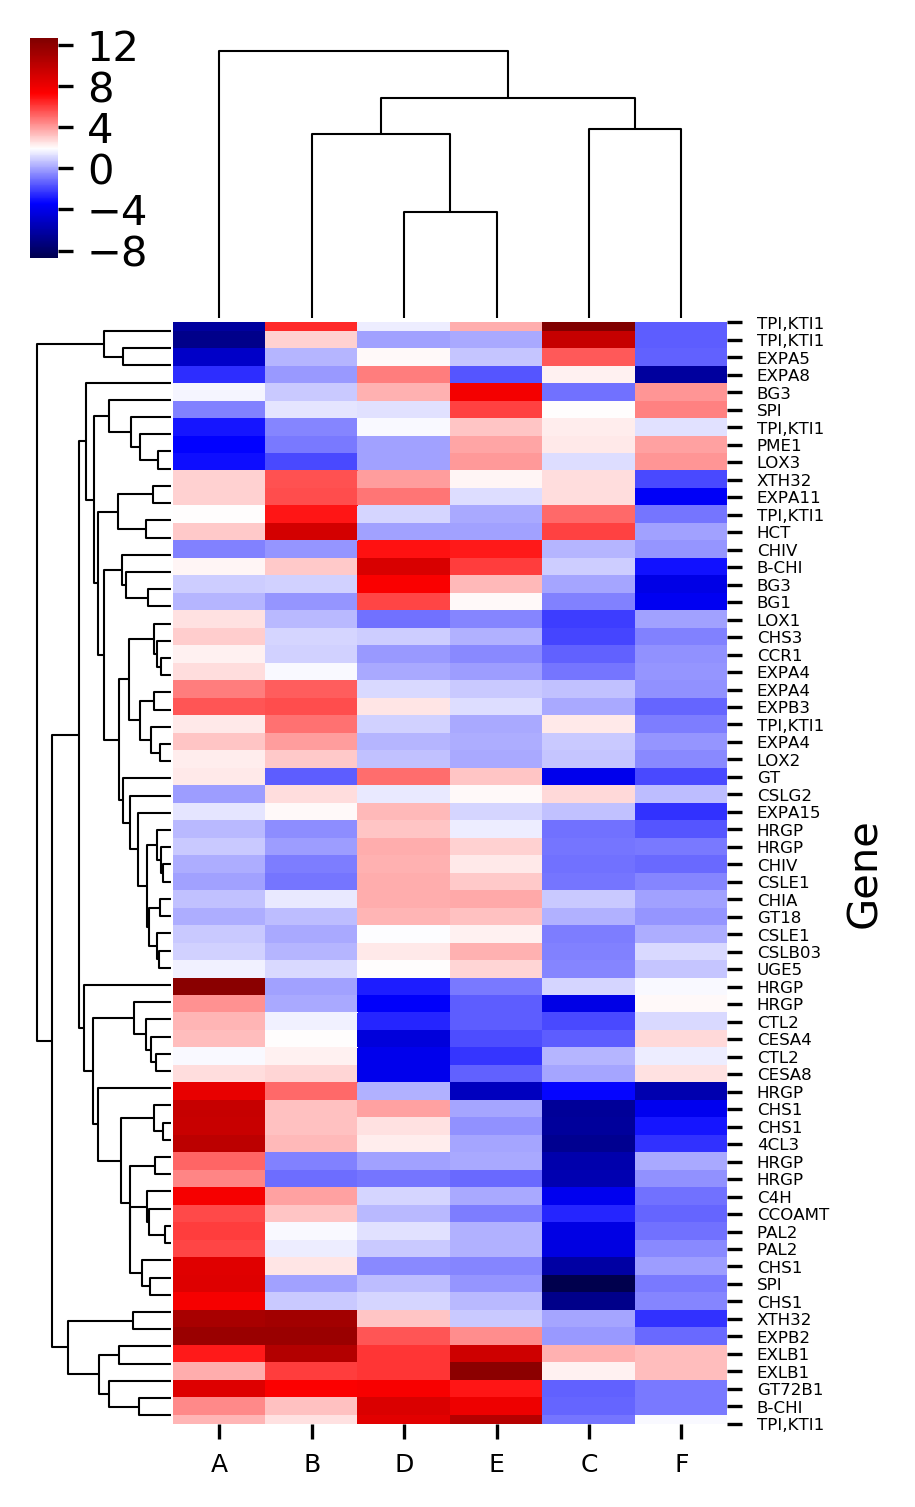
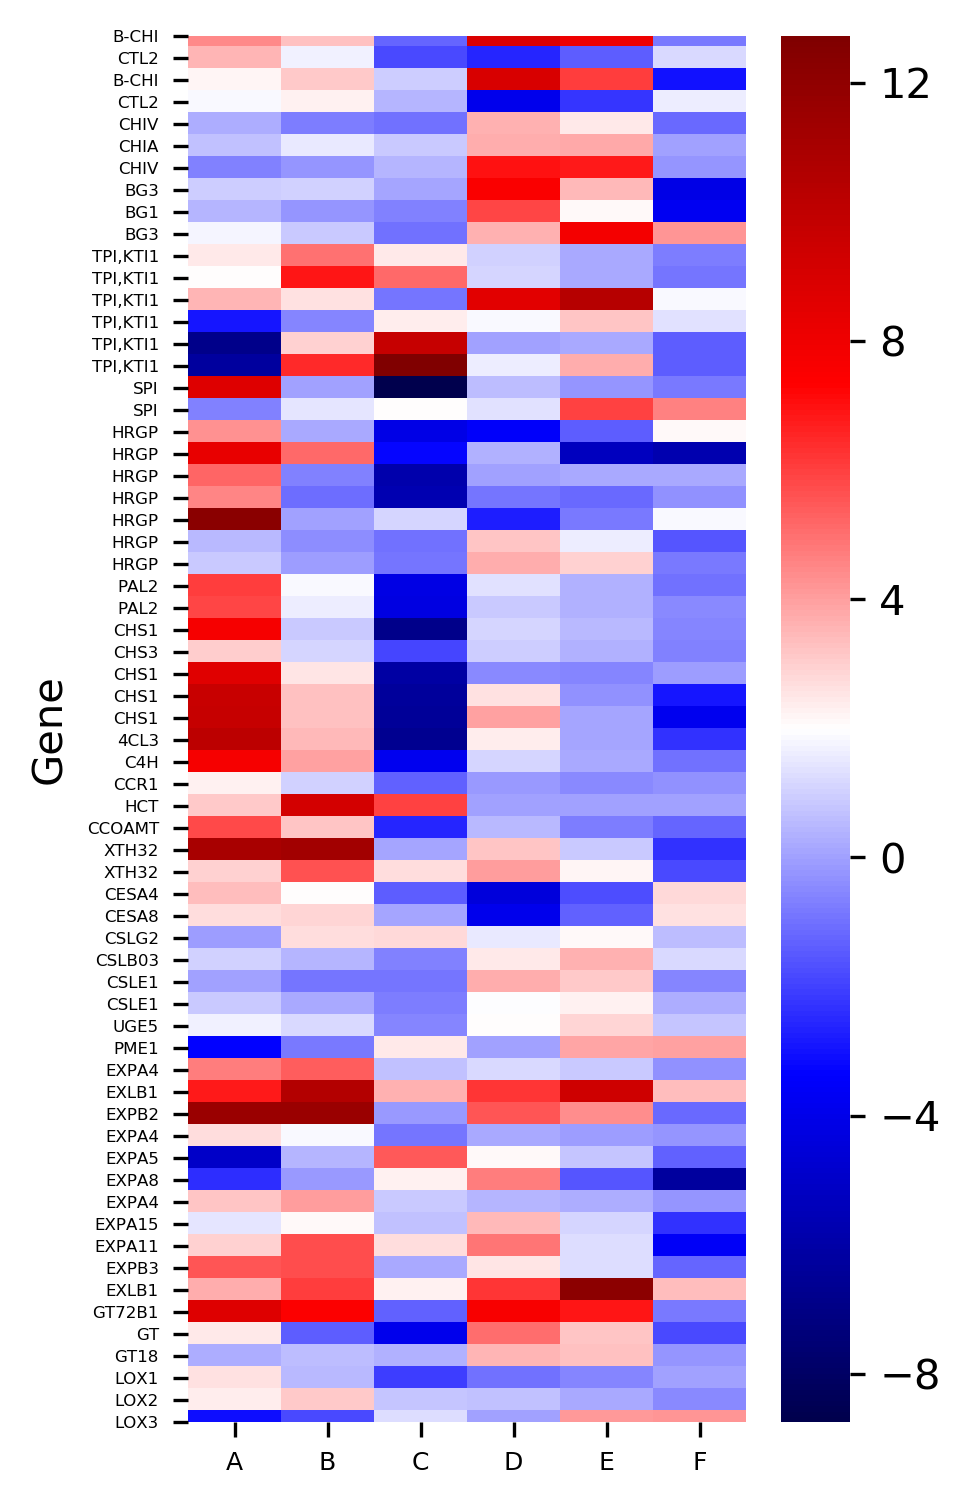
The X-axis represents the treatment conditions and Y-axis represents the gene names. I have changed the names of six treatment conditions to A to F for the simplicity of understanding. You can Read paper for a detailed understanding of the dataset.
Now plot heatmap with different colormaps,
# colormaps are available at  https://matplotlib.org/3.1.0/tutorials/colors/colormaps.html
# default is seismic
# here I use red-yellow-green: RdYlGn
>>> visuz.gene_exp.hmap(df=df, cmap='RdYlGn', dim=(3, 6), tickfont=(6, 4))

# heatmap without hierarchical clustering
>>> visuz.gene_exp.hmap(df=df, clus=False, cmap='RdYlGn', dim=(3, 6), tickfont=(6, 4))
Generated heatmaps with a red-yellow-green colormap,
Now plot heatmap with standardized values,
# Z-score can be used to standardize value with mean 0 and var 1
# default Z-score is set to None and it applies to only heatmap with cluster
# here I standardize column with Z-score
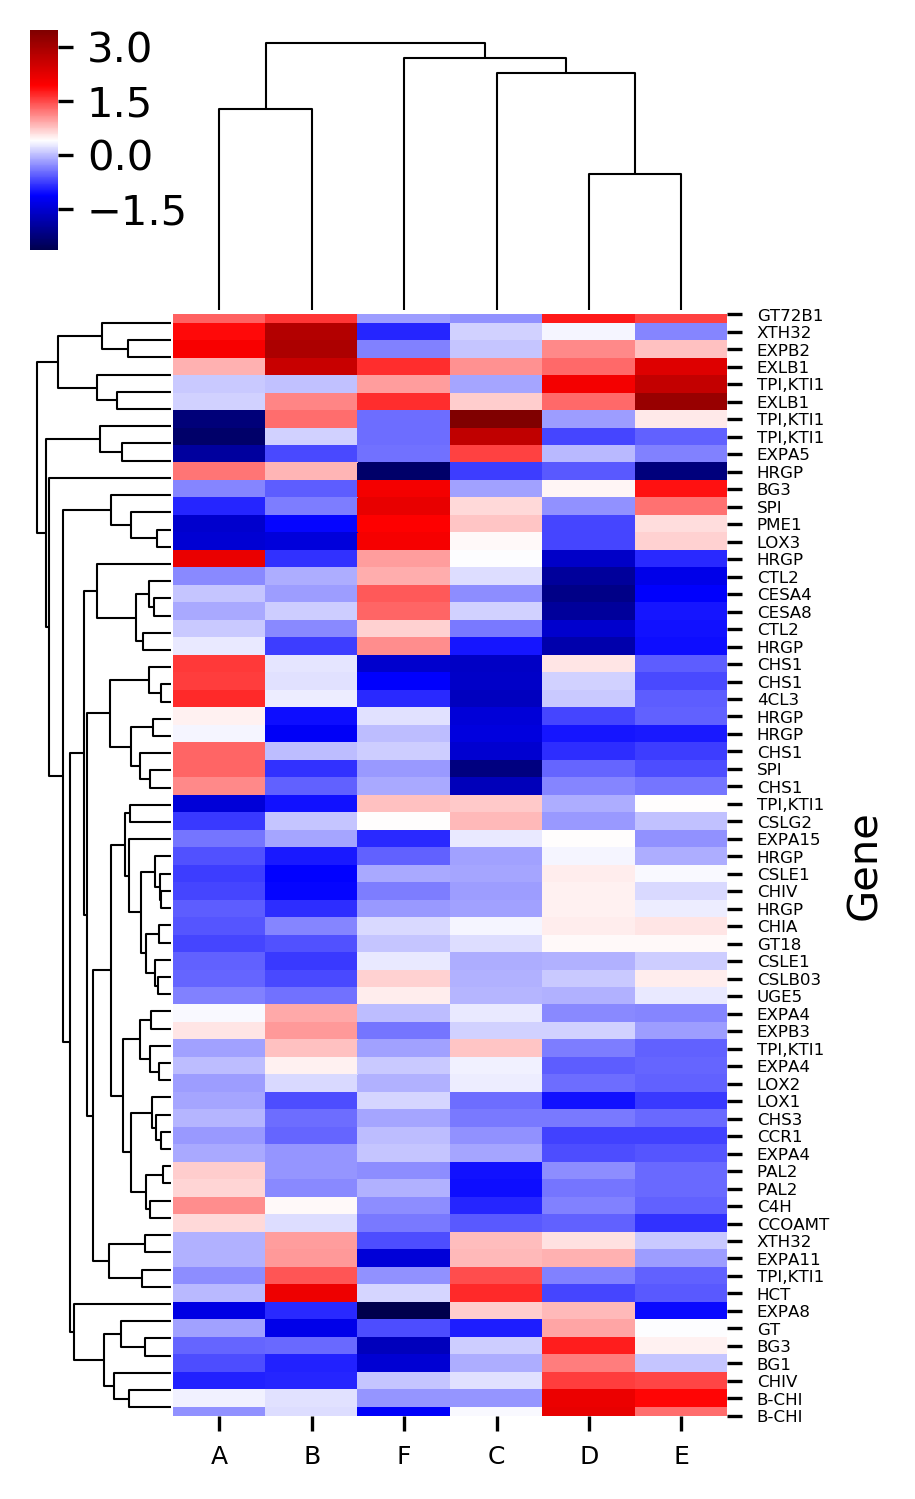
>>> visuz.gene_exp.hmap(df=df, zscore=1, dim=(3, 6), tickfont=(6, 4))
# here I standardize row with Z-score
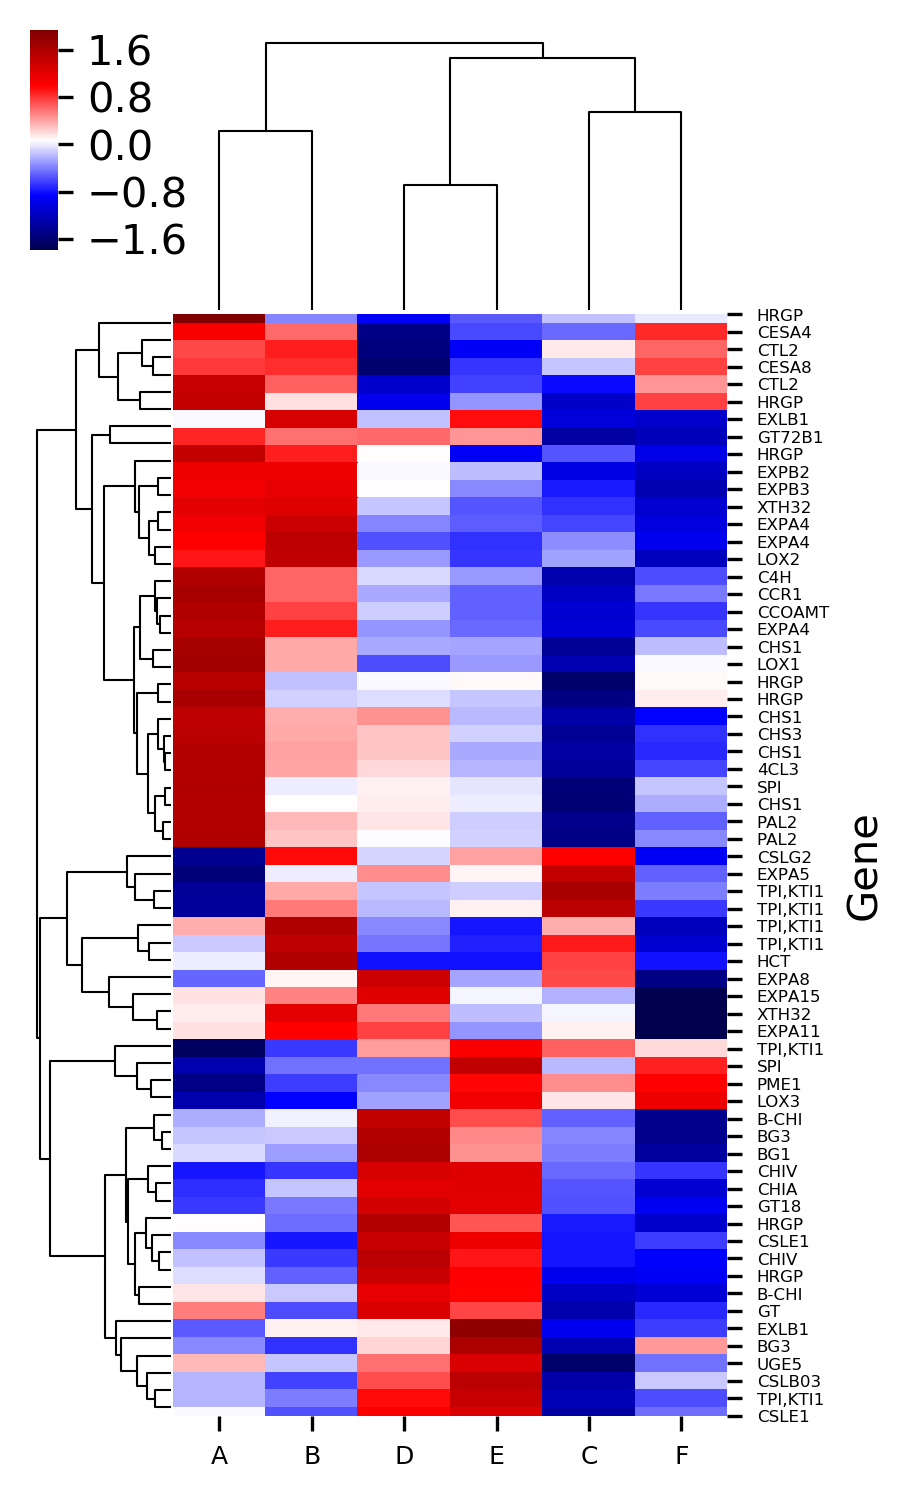
>>> visuz.gene_exp.hmap(df=df, zscore=0, dim=(3, 6), tickfont=(6, 4))
Generated heatmaps with Z standardized column and row,
In addition to these features, we can also control the label fontsize, figure size, resolution, figure format, and scale of the heatmaps.
References:
- Michael Waskom, Olga Botvinnik, Joel Ostblom, Saulius Lukauskas, Paul Hobson, MaozGelbart, … Constantine Evans. (2020, January 24). mwaskom/seaborn: v0.10.0 (January 2020) (Version v0.10.0). Zenodo. http://doi.org/10.5281/zenodo.3629446
- Bedre R, Rajasekaran K, Mangu VR, Timm LE, Bhatnagar D, Baisakh N. Genome-wide transcriptome analysis of cotton (Gossypium hirsutum L.) identifies candidate gene signatures in response to aflatoxin producing fungus Aspergillus flavus. PLoS One. 2015;10(9).
Last updated: April 9, 2020