Bar graph with overlapping dots (Bar-dot) plot
What is the Bar-dot plot?
- This is a regular bar graph of the mean of data of each variable with overlapping dots for individual observation for that variable
- A good way to represent the mean of the variable with standard error bar and distribution of each observation
How to create Bar-dot plot?
- We will use
bioinfokit v0.6or later - Check bioinfokit documentation for installation and documentation
- Download dataset for creating bar-dot plot
Useful reading: Data handling using pandas
# you can use interactive python interpreter, jupyter notebook, spyder or python code
# I am using interactive python interpreter (Python 3.7)
>>> from bioinfokit import analys, visuz
# load dataset as pandas dataframe
# data should not have missing values (NaN)
>>> df = analys.get_data('bdot').data
>>> df.head()
A B C D
0 25 45 30 60
1 30 55 36 60
2 28 45 35 65
3 36 56 37 62
4 29 40 48 73
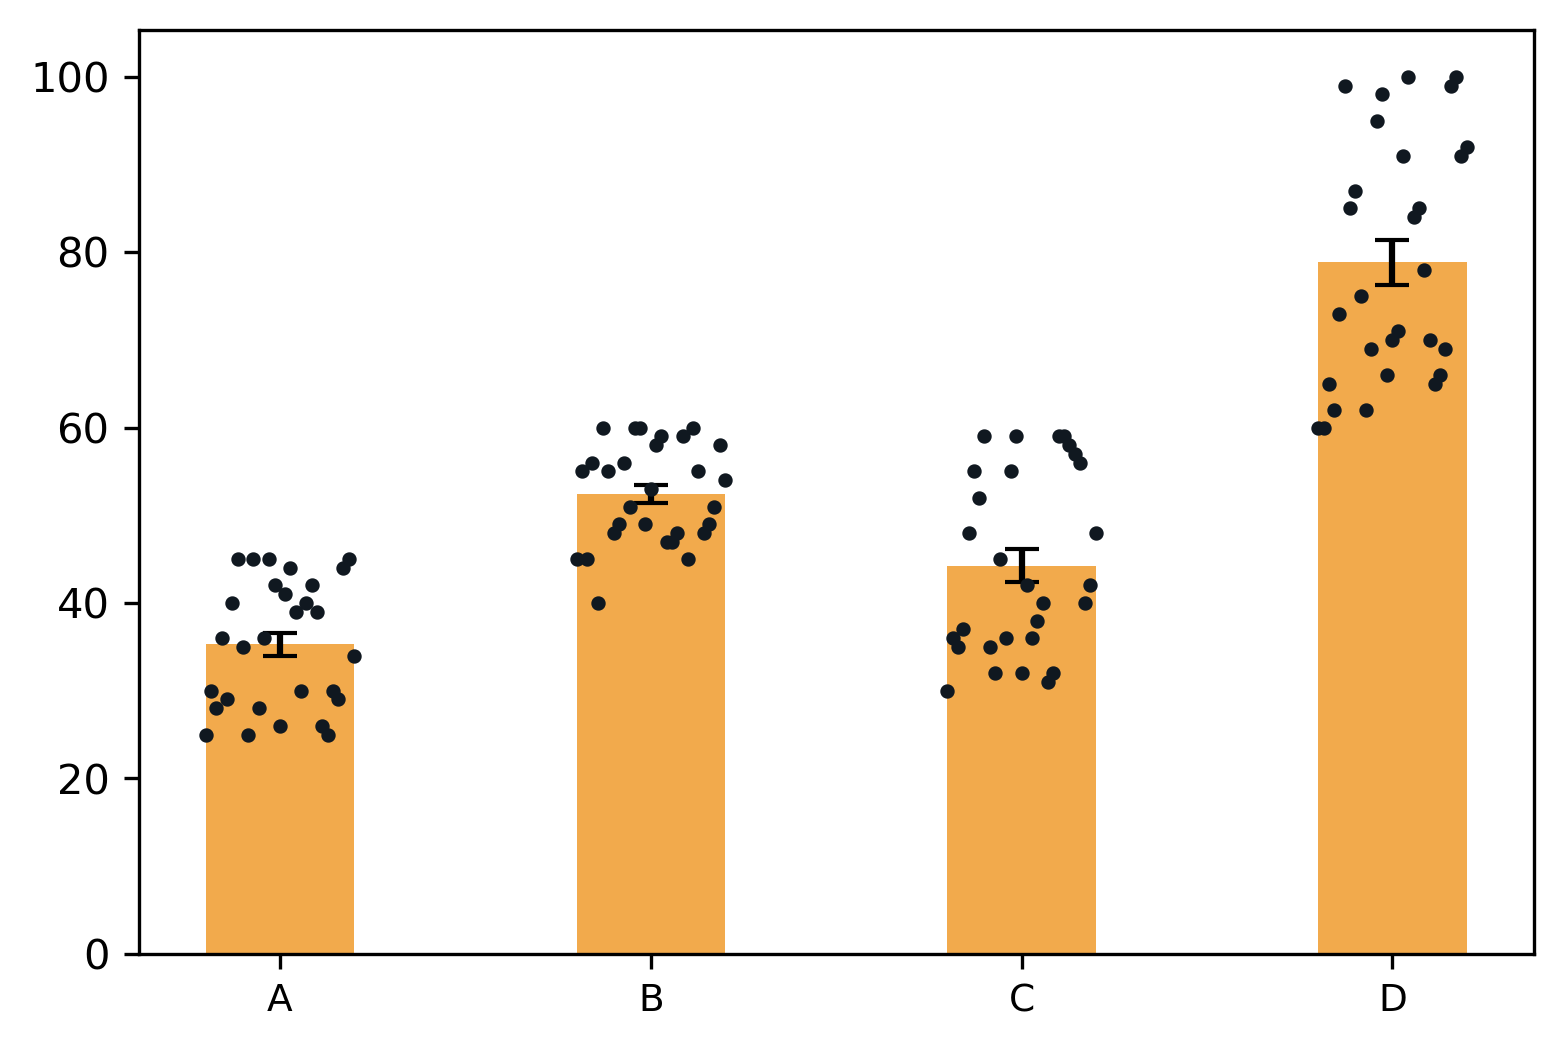
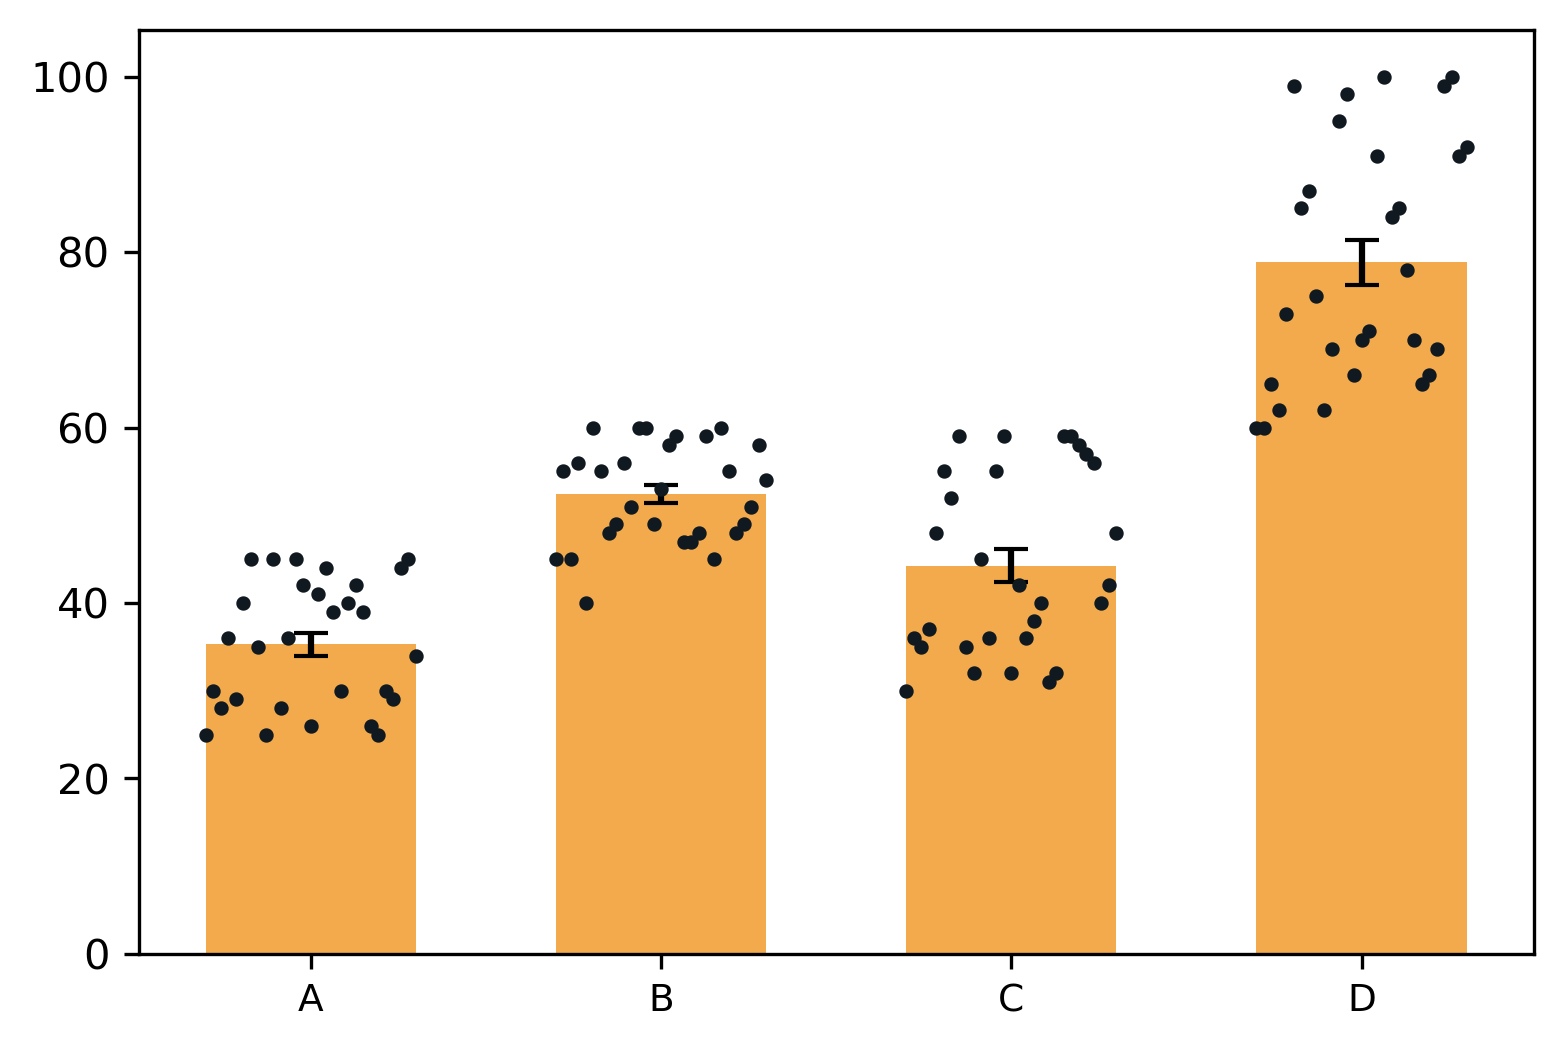
# create bardot plot with default parameters
>>> visuz.stat.bardot(df=df)
# set parameter show=True, if you want view the image instead of saving
# visuz.stat.bardot(df=df, show= True)
Generated Bar-dot plot,
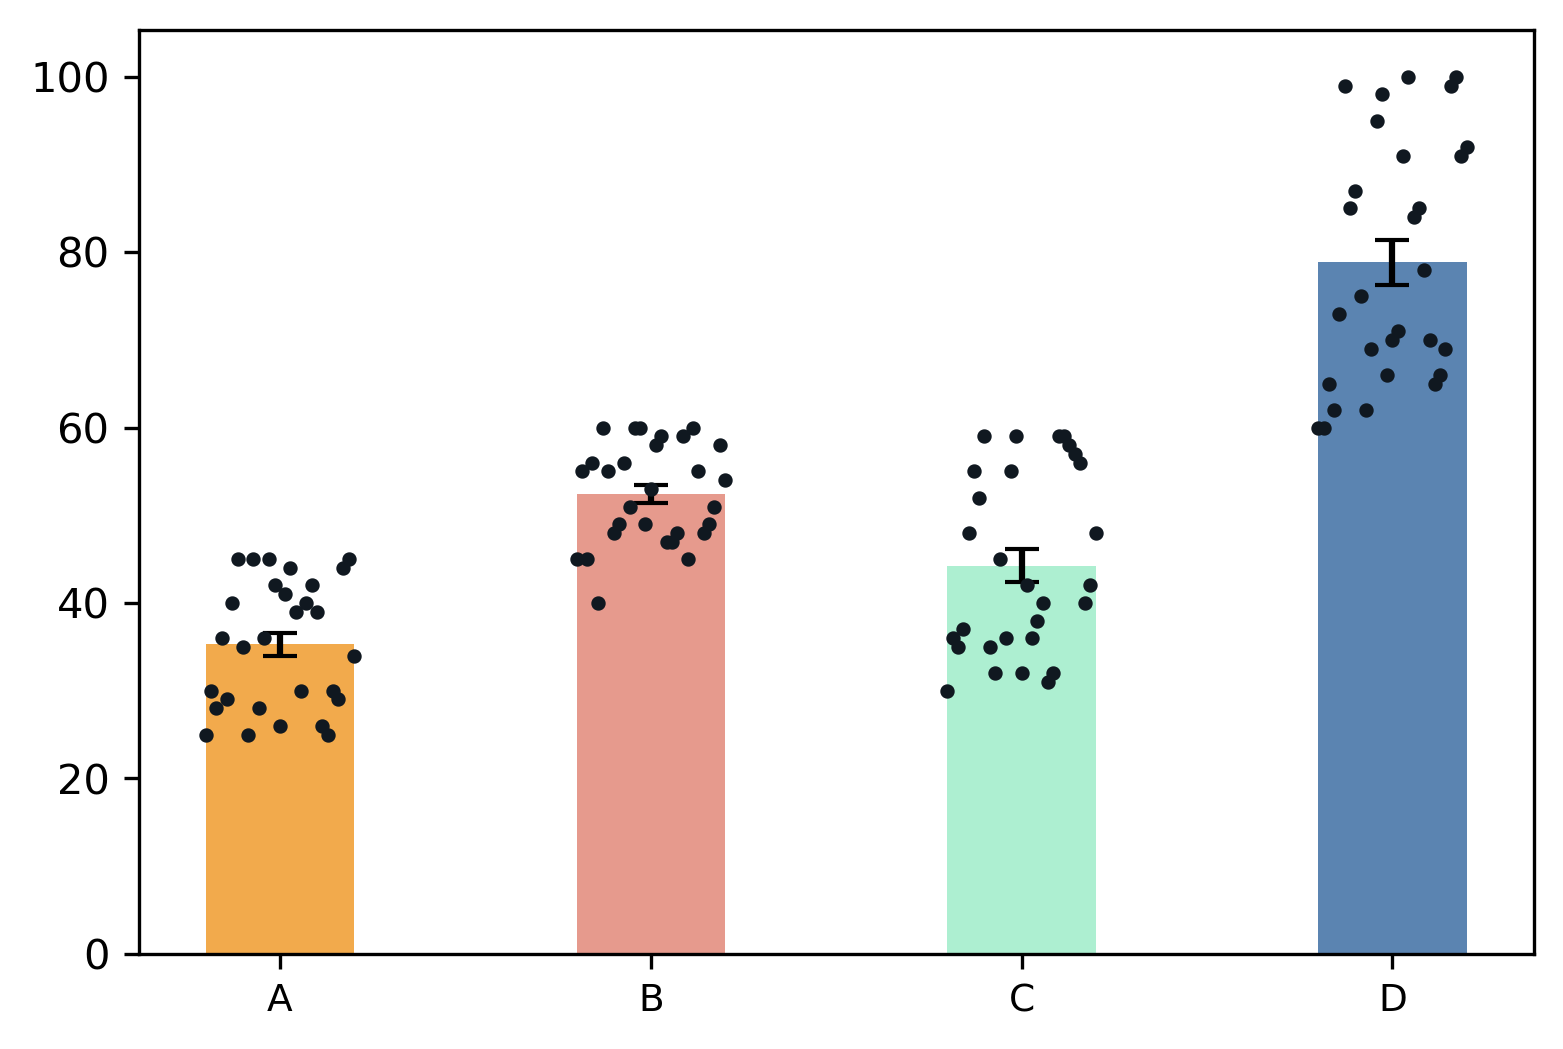
Change bar colors
# add different color to each bar
>>> visuz.stat.bardot(df=df, colorbar=("#f2aa4cff","#e69a8dff", "#adefd1ff", "#5b84b1ff") )
Change dot colors
# change dot color for all bars
>>> visuz.stat.bardot(df=df, colordot=["#616247ff"])

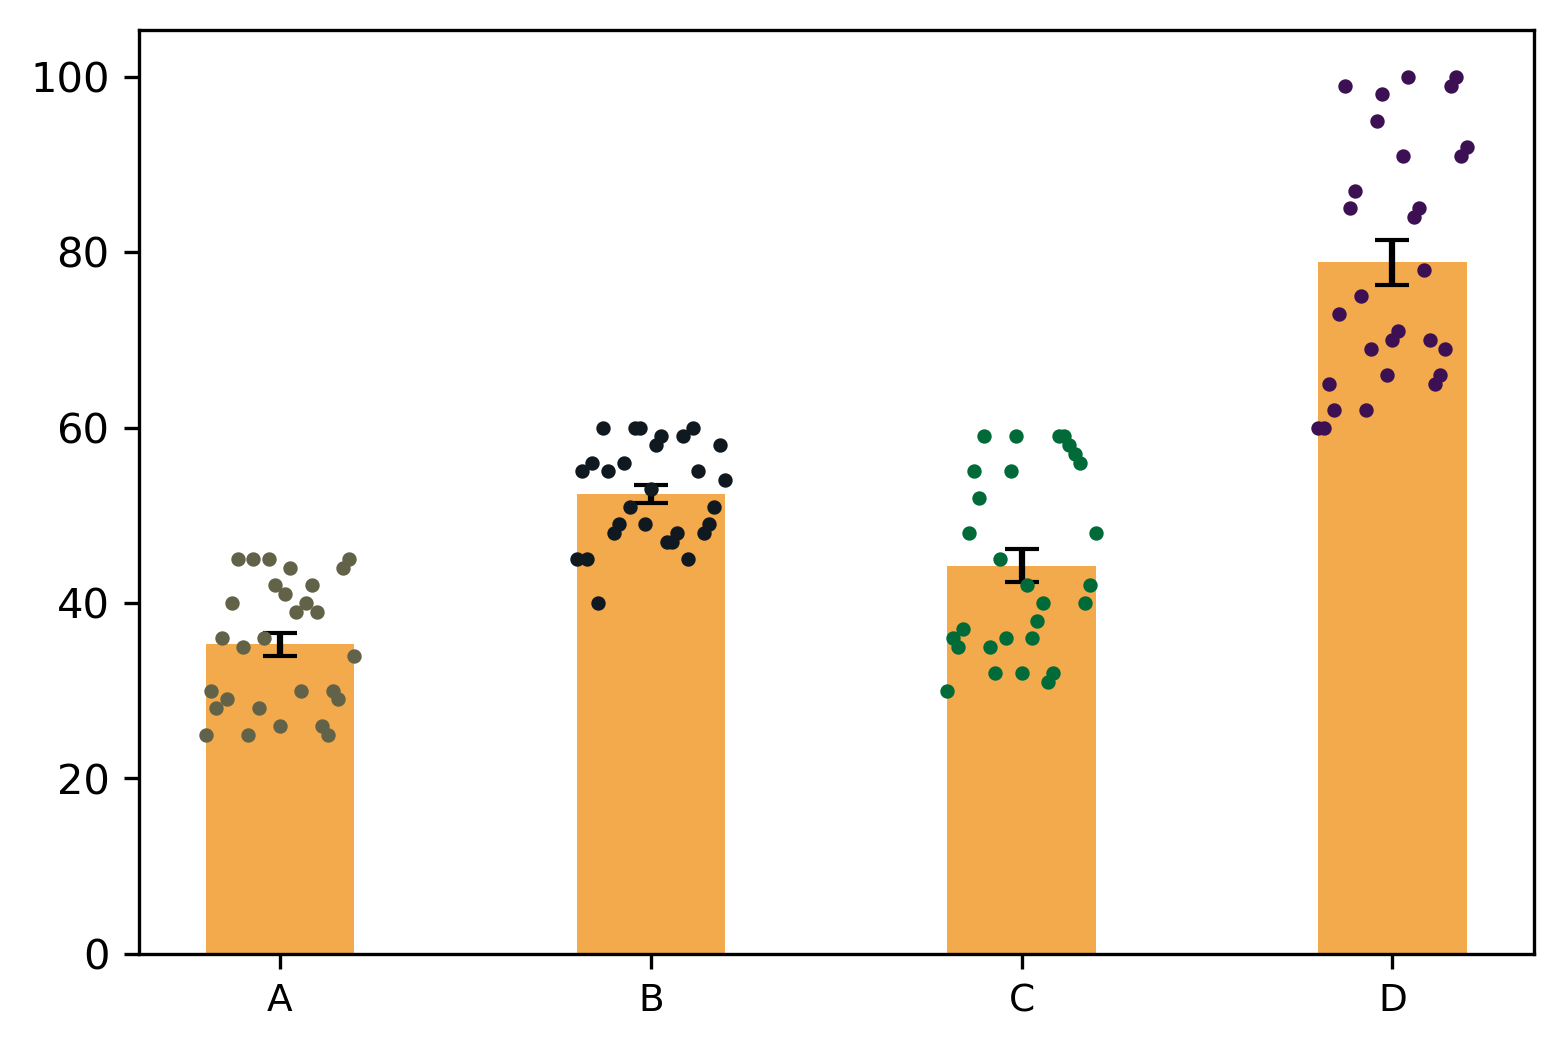
# change dot color for each bar
>>> visuz.stat.bardot(df=df, colordot=["#616247ff", "#101820ff", "#006b38ff", "#3c1053ff"]  )
Change shape of dots
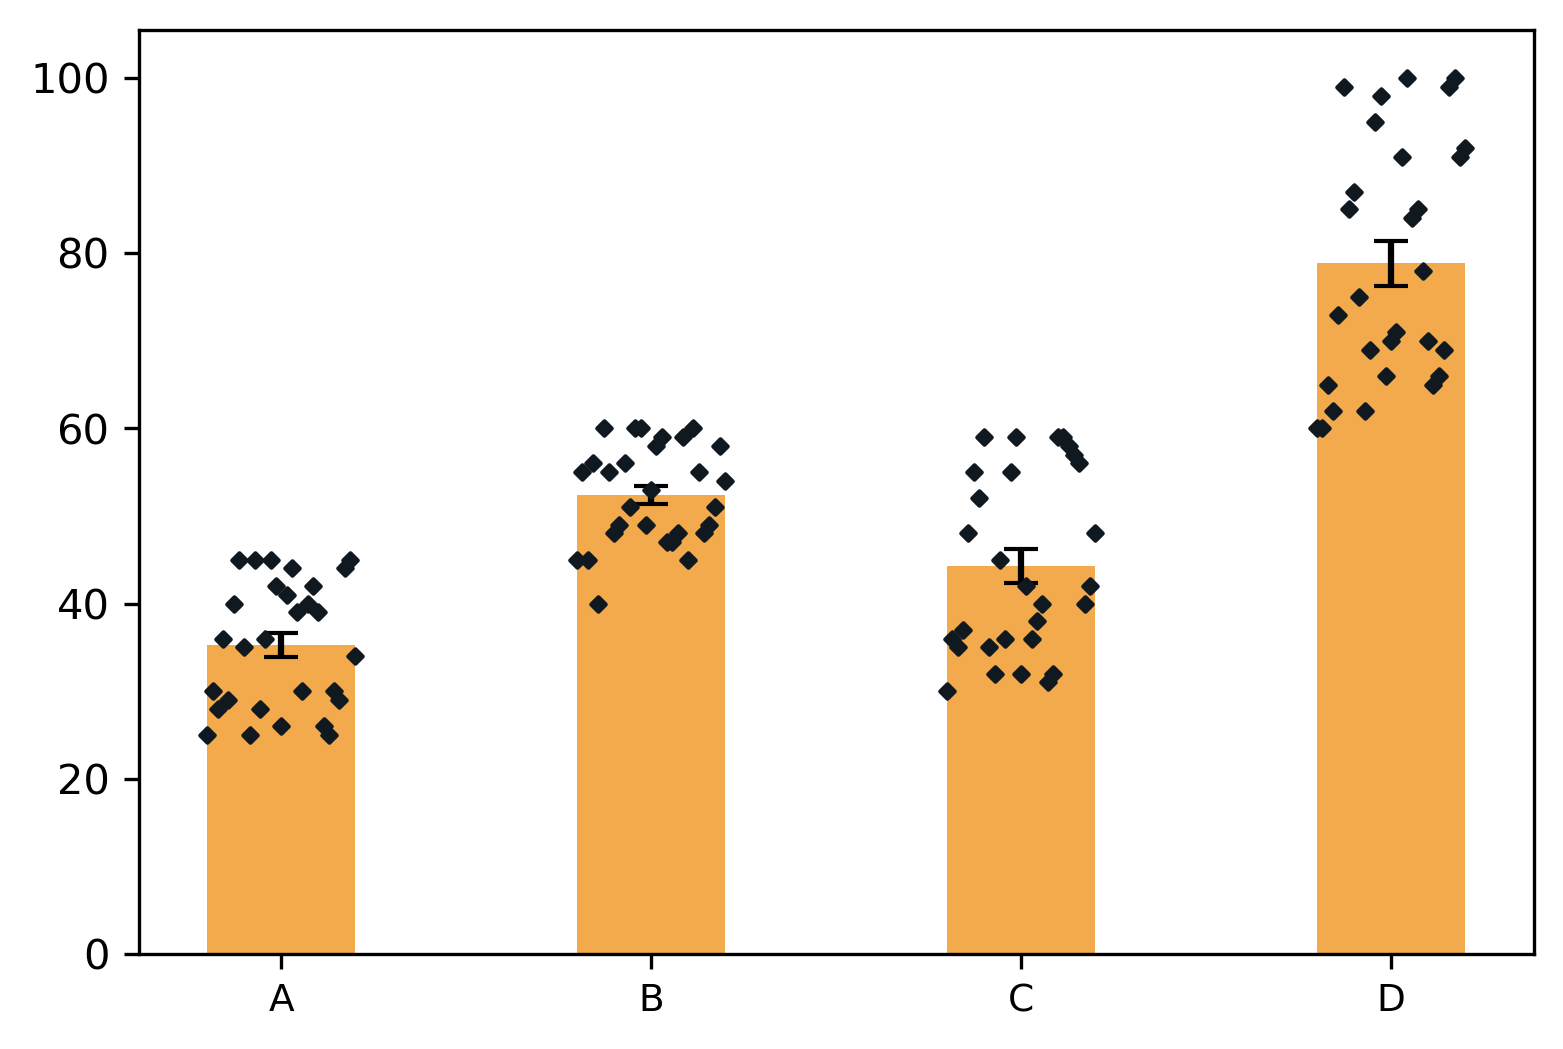
# change shape of dot
# see available shapes at https://matplotlib.org/3.1.1/api/markers_api.html
>>> visuz.stat.bardot(df=df, markerdot="D")
Change the bar width,
# change shape of dot
# see available shapes at https://matplotlib.org/3.1.1/api/markers_api.html
>>> visuz.stat.bardot(df=df, bw=0.6)
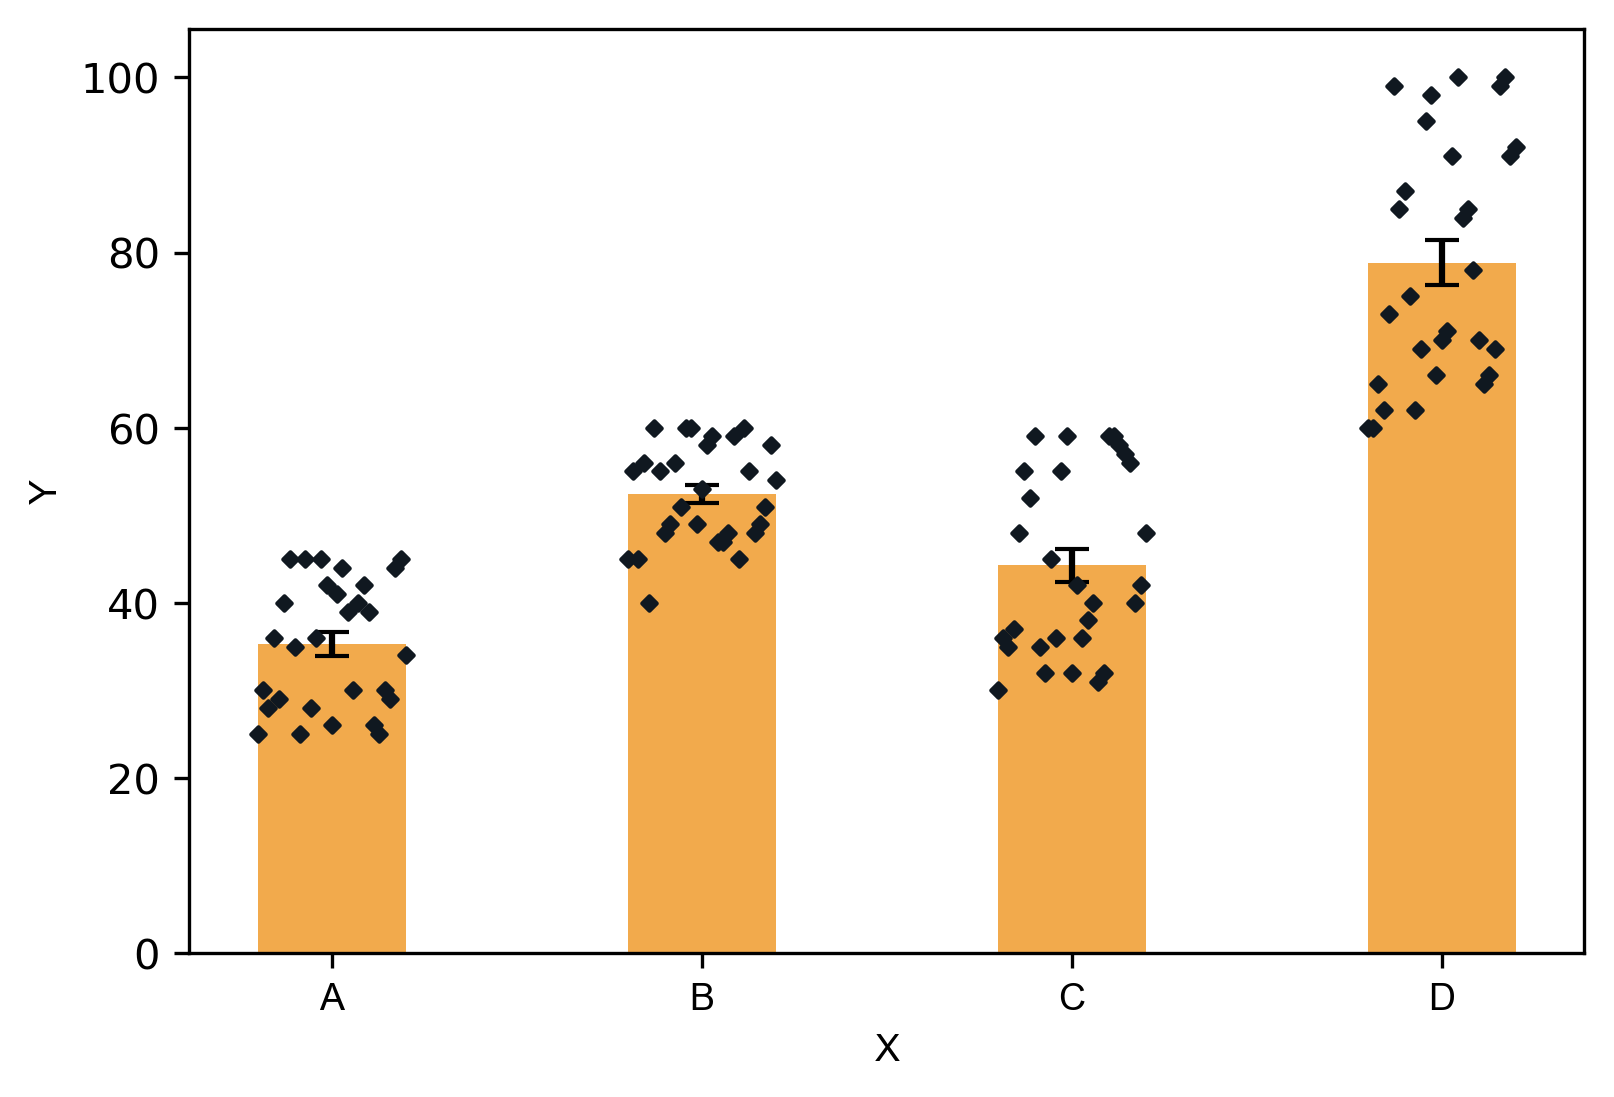
Add the labels to the axis,
>>> visuz.stat.bardot(df=df, axxlabel='X', axylabel='Y')
In addition to these parameters, the parameters for figure type (figtype), figure dimension (dim), Y axis ticks range (ylm), axis labels (axxlabel, axylabel),
axis labels font size and name (axlabelfontsize, axlabelfontname), resolution (r), and axis tick labels font size and font name (axtickfontsize, axtickfontname)
can be provided.
Last updated: April 9, 2020